Overview of BAT
Workflow
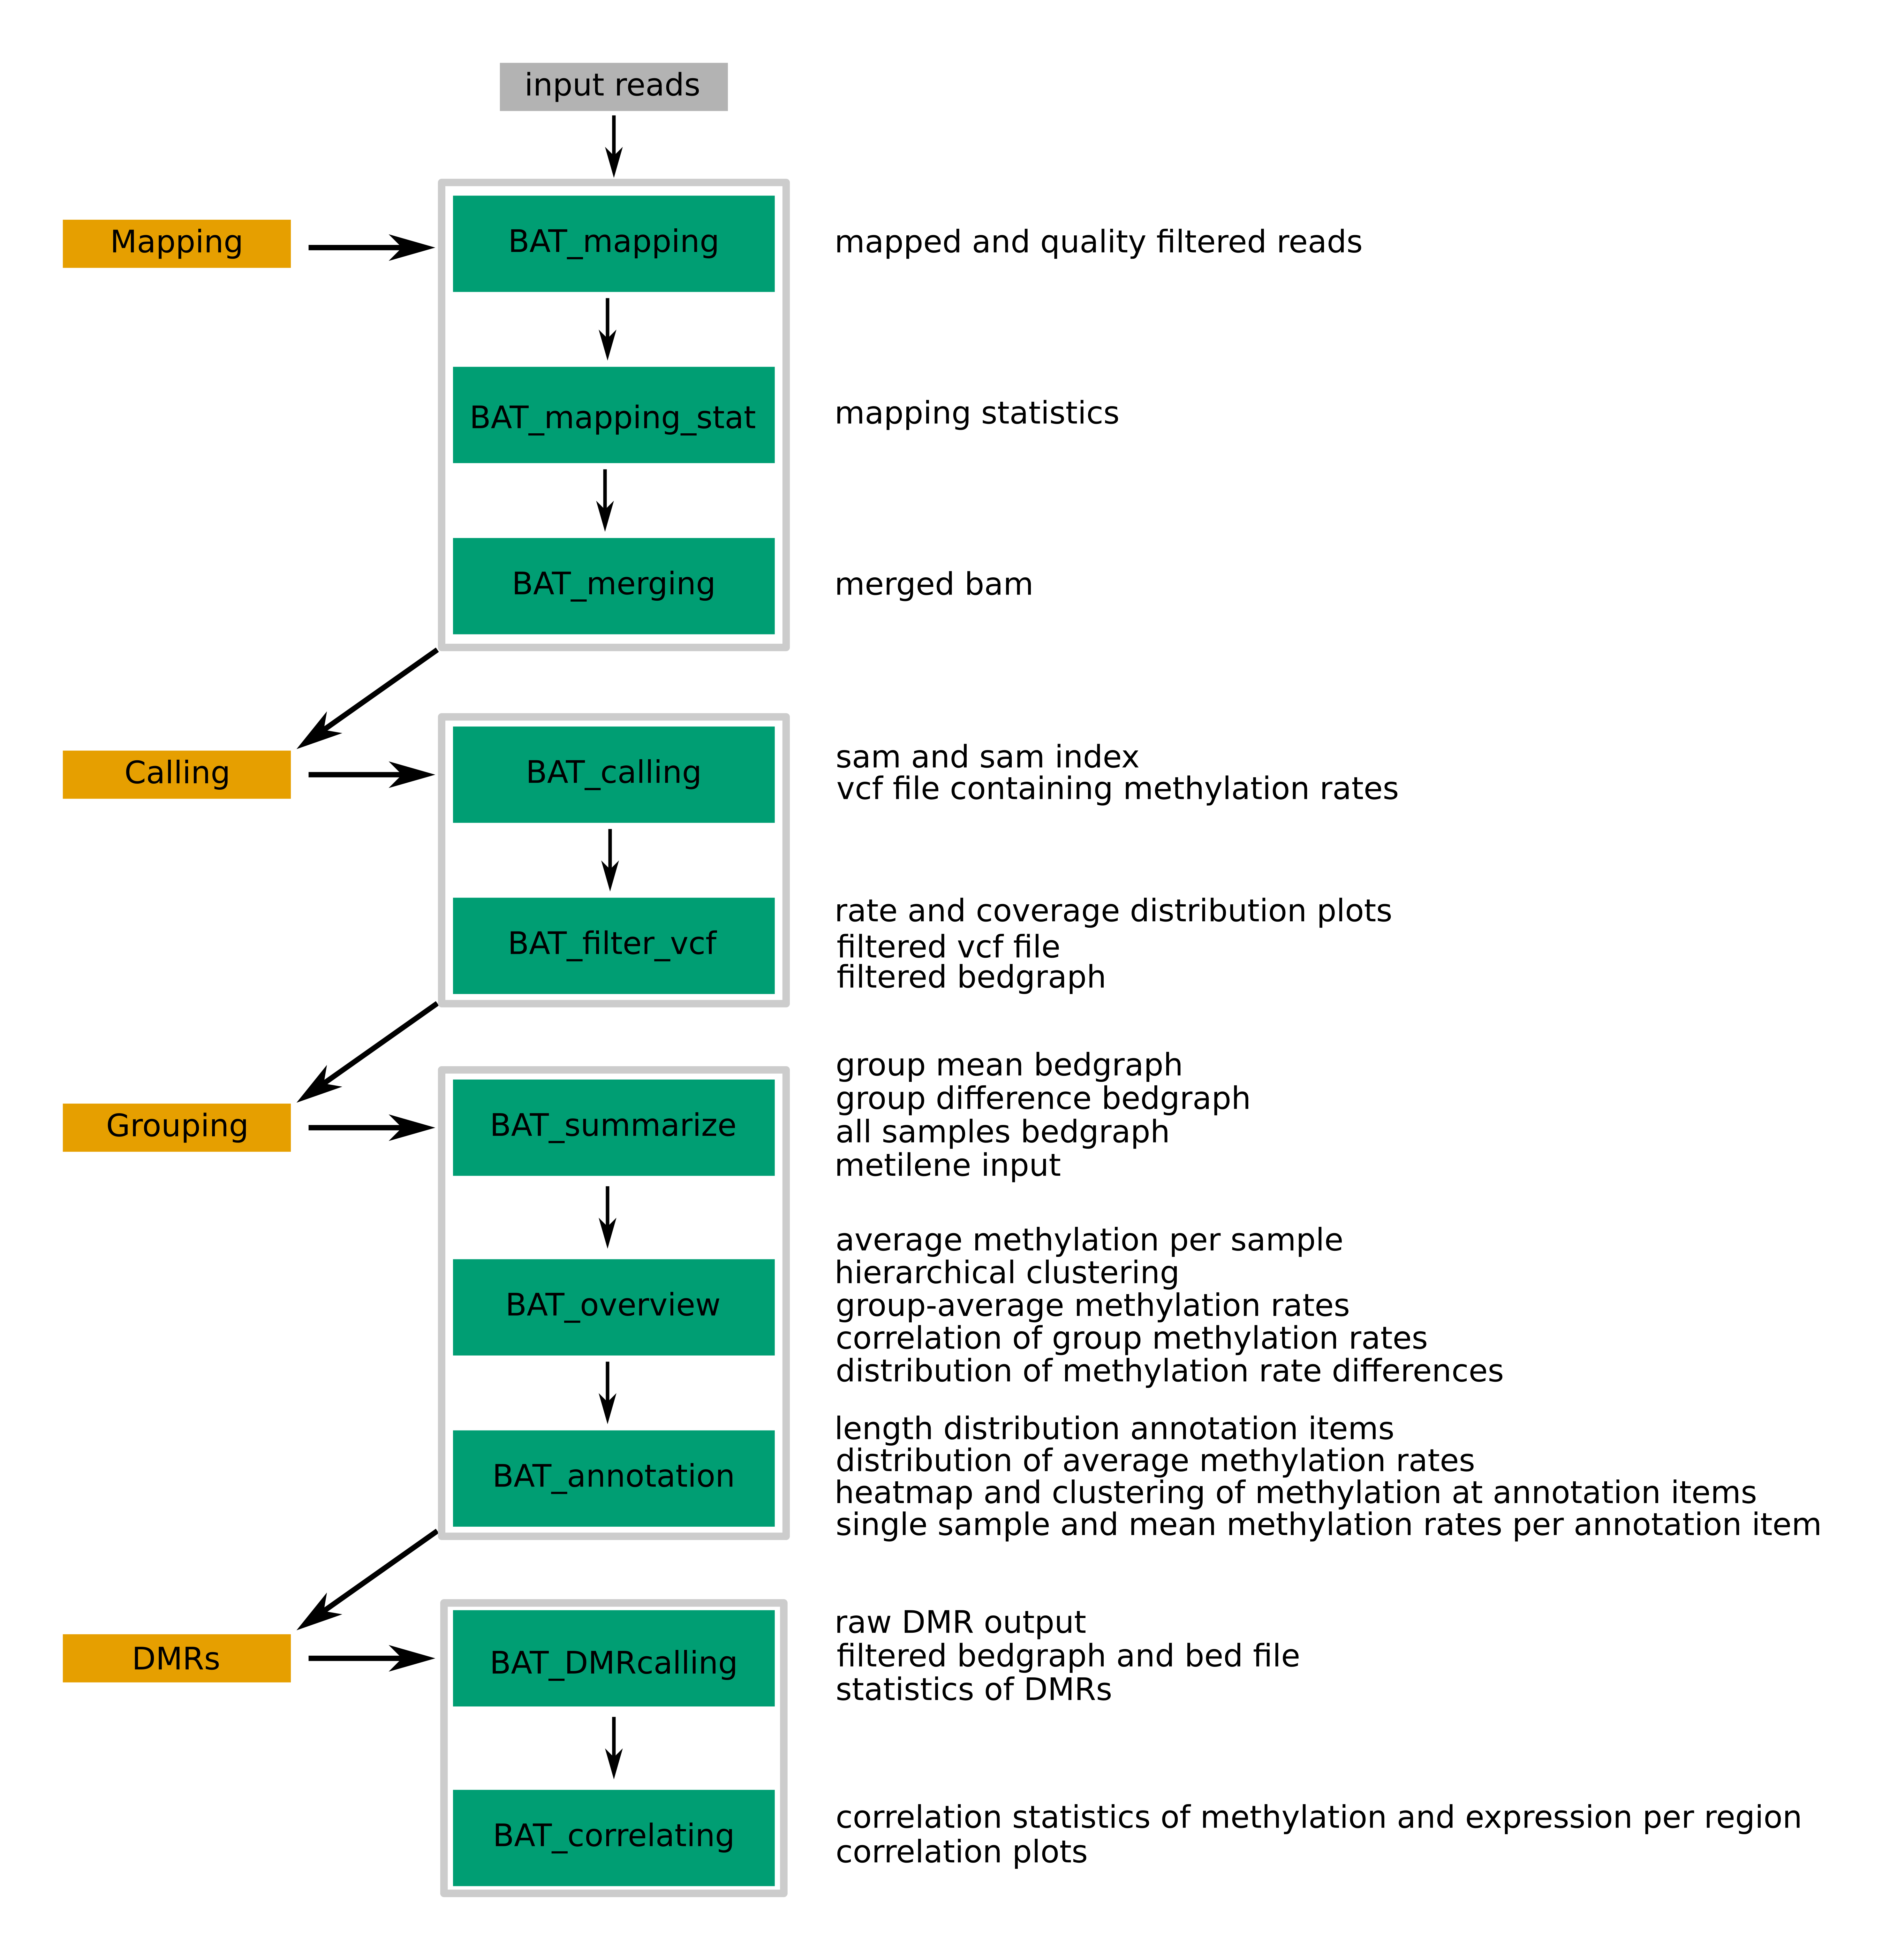
The basic workflow is shown in the following flow chart:

Modules
The toolkit can readily be employed for the analysis of whole-genome bisulfite sequencing (WGBS) and reduced representation bisulfite sequencing (RRBS) data.
The first module comprises read mapping including pre- and postprocessings. For mapping, BAT_mapping employs segemehl, a performant and highly sensitive short-read aligner with a specialized bisulfite mode (link), but due to the modularity of BAT, this step could be exchanged by running a different bisulfite-sensitive aligner. In addition to a bisulfite-specific quality filtering, aligned reads are converted to an indexed and sorted BAM file. Basic mapping statistics such as the number of mapped pairs/reads, the number of reads with a single (unique-mapped) or multiple alternative alignments (multi-mapped), the distribution of the multiplicity of read alignment, and the distribution of the edit distance of read alignments are calculated by BAT_mapping_stat. If there are multiple datasets per sample (e.g., due to multiplexing on different lanes), all alignment files corresponding to one sample can be merged using BAT_merging. It also enables the addition of dataset-specific read group information during the merging process.
Following mapping, the methylation information needs to be extracted from the alignments, referred to as methylation calling. First, BAT_calling takes the alignments and generates a VCF file that contains information for each cytosine including the sequence context, coverage, detailed number of covering nucleotides, and the estimated methylation rate. Second, cytosine positions can be filtered by coverage, genomic context, and methylation rate, using BAT_filtering. The output is again in VCF format but it is also provided as bedGraph file with the estimated methylation rate in the fourth column, ready for loading in IGV or uploading to the UCSC genome browser. Furthermore, the coverage and methylation rate distributions for all and filtered positions are illustrated as barplots.
The third module covers the basic analysis of two groups of a single sample or up to multiple samples. At first, various helpful summary, bedGraph and bigWig files for all samples are created with BAT_summarize. Furthermore, a Circos plot containing a methylation rate heatmap for each sample could be provided. Overview plots comprising hierarchical clustering, genome-wide average methylation rate boxplots, correlation plots of mean group methylation rates per position and distribution of position-wise group differences are plotted. Specific regions of interest or annotations, e.g., transcription factor binding sites (TFBS), CpG islands, promoter regions, BAT_annotation can be used to get an insight into the methylation of the samples in those regions. Basic statistics, like length of annotation items (in nucleotides and Cs), are calculated. In addition, the distribution of the average group-wise methylation rates per annotation item, clustering heatmaps containing all samples, and boxplots of the single sample average methylation rates per annotation item are shown.
Finally, the calling analysis of DMRs is coverd by BAT_DMRcalling and BAT_correlating. The DMR calling tool metilene identifies DMRs between two groups from one or more samples very quickly and accurately. Subsequently, the raw metilene output can be filtered and converted to BED-like or bedGraph format. Basic DMR statistics including length distributions (in nucleotides and Cs), distribution of group methylation differences, and scatterplots of methylation means of group 1 vs. group 2 as well as methylation difference vs. q-value of DMRs is illustrated. Finally, BAT_correlating facilitates the identification of correlating DMRs (cDMRs), i.e., DMRs where the methylation change correlates with a change in the expression of the associated genes. However, it is not restricted to DMRs as input but can also be used for inspecting other annotation items such as promoter regions or TFBS. In result, linear and non-linear correlation effects are tested and the results are reported as text file and correlation plot for easy visual inspection.
Downloads
- BAT scripts one by one
- input data (54 MB)
- run script
- entire example folder (985 MB)